

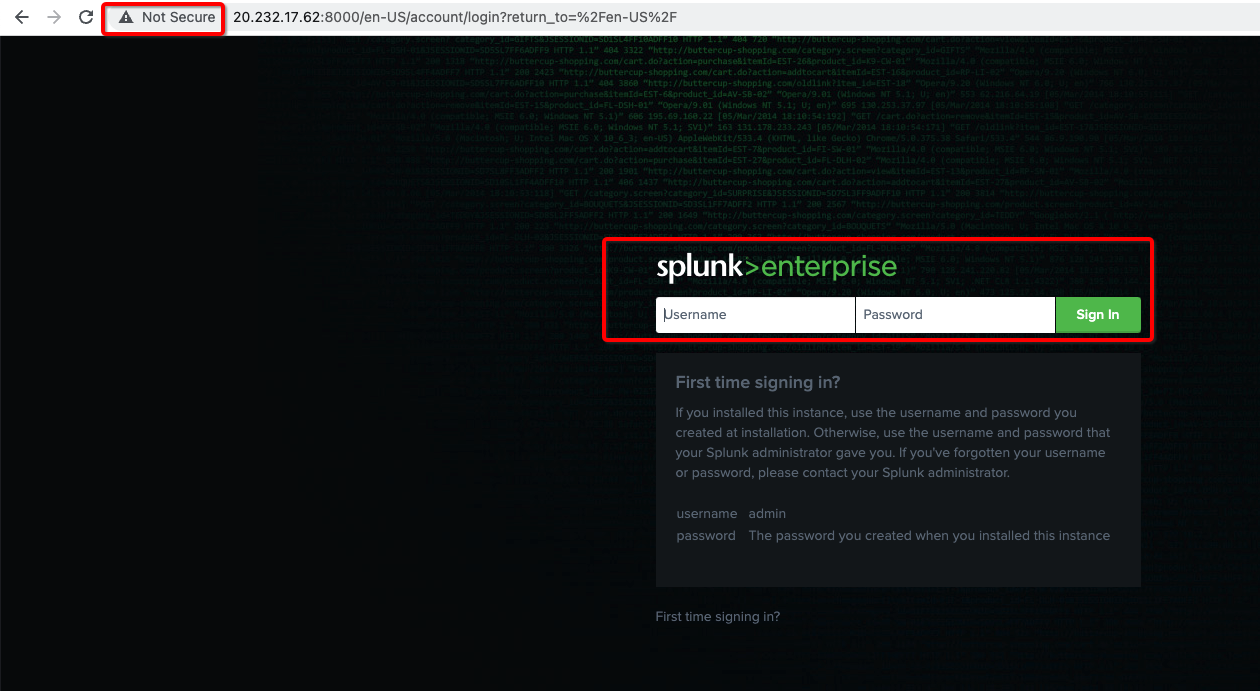
Create Splunk HTTP Event Collector
- Log in to Splunk instance as an administrator.
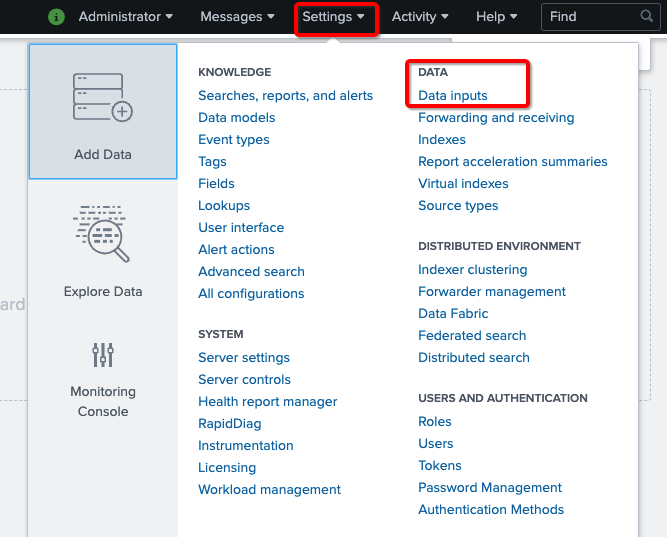
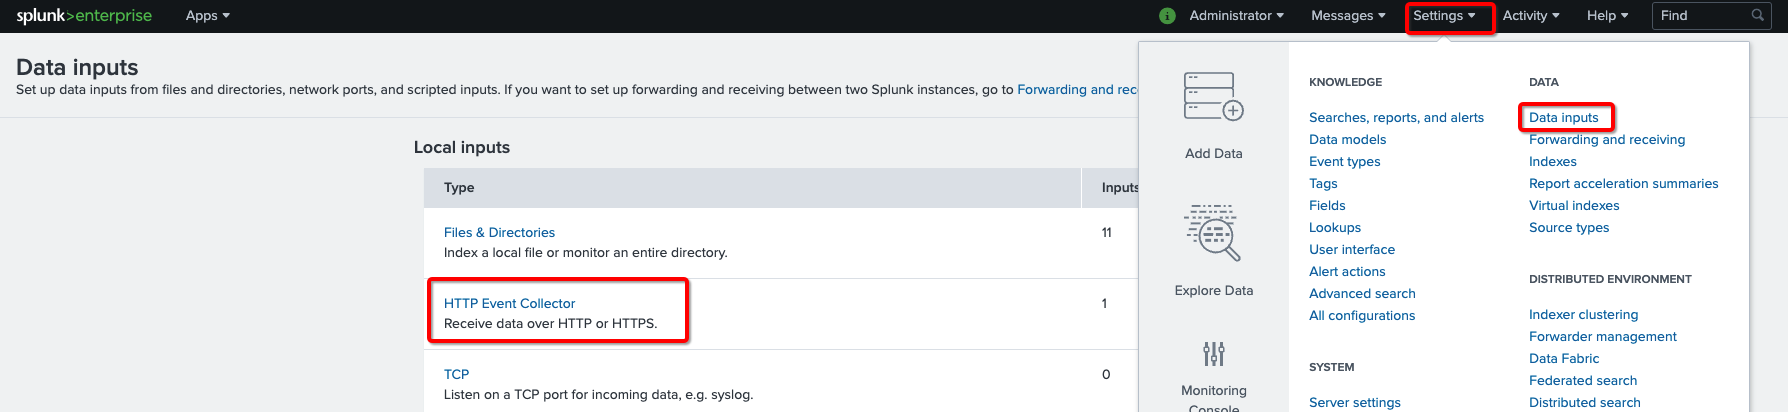
- Navigate to Settings
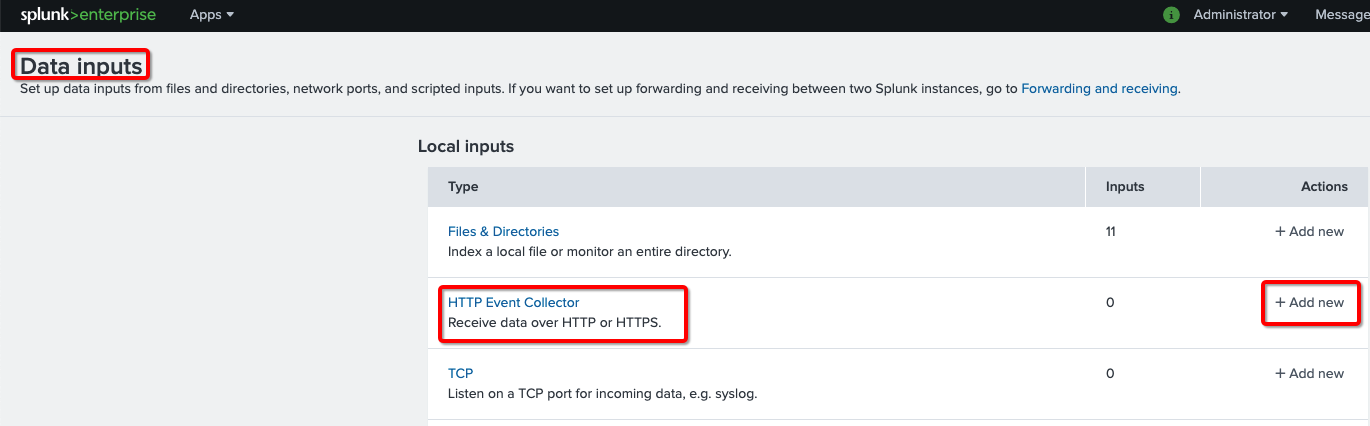
- Select Data inputs from the DATA section.
- Click on the + Add new link to create a new HTTP event collector (HEC).
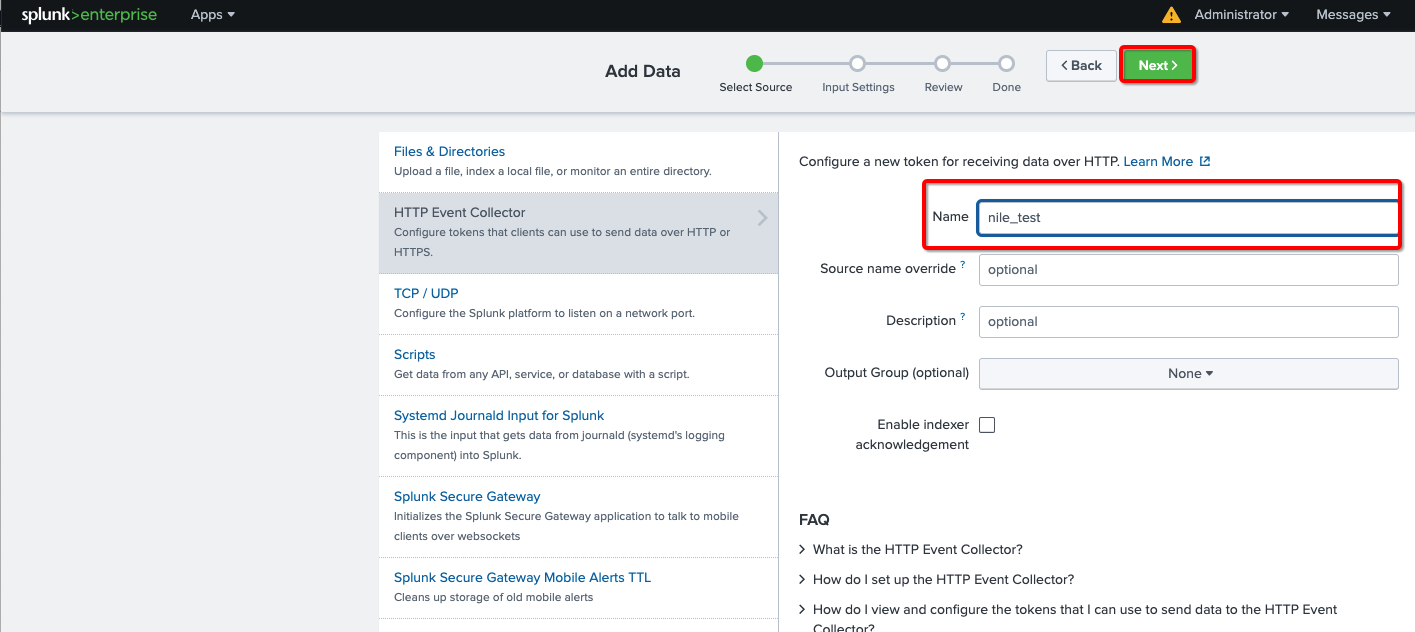
- Type a descriptive name for the collector – in this example, we will use “nile_test”.
Keep all other values at their default value (“optional”). - Click the Next button
- Keep the Source Type as Automatic;
Keep the index as “main”.
NOTE: HEC data will be stored at by default in the main index; you can create a specific index by clicking on the Create a new index This can be changed at any time. This example uses the main index; in production, use a sandbox index first then change the setting later. - Click the Review button
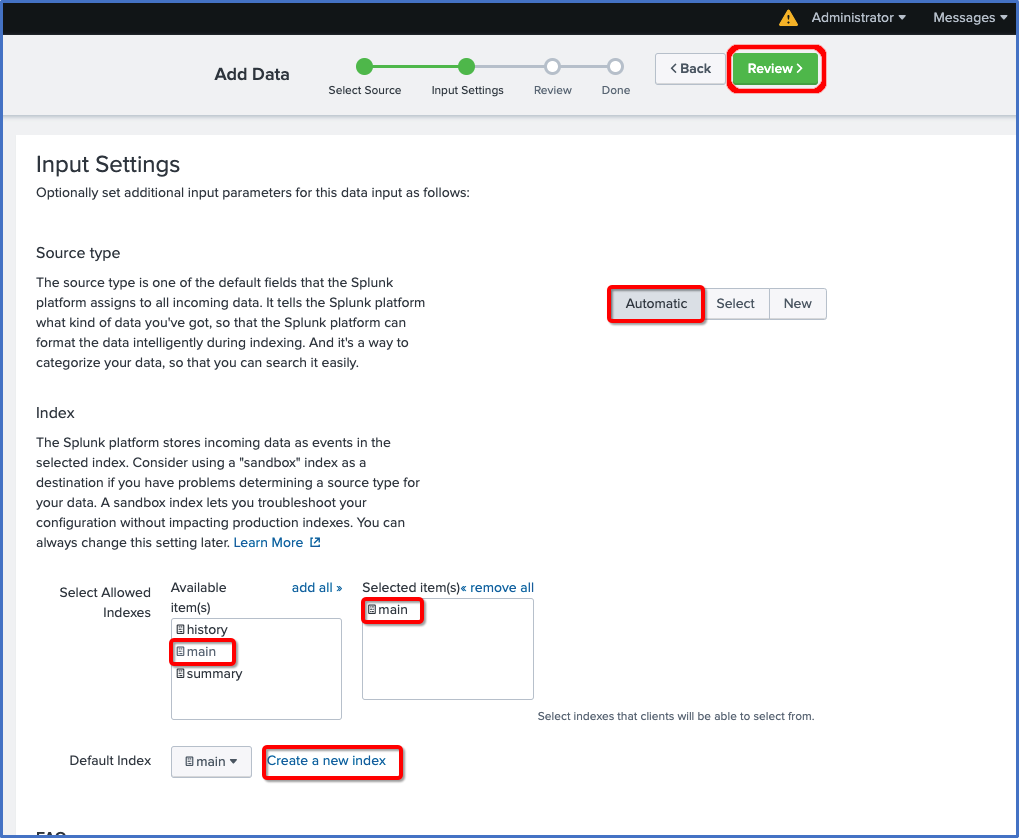
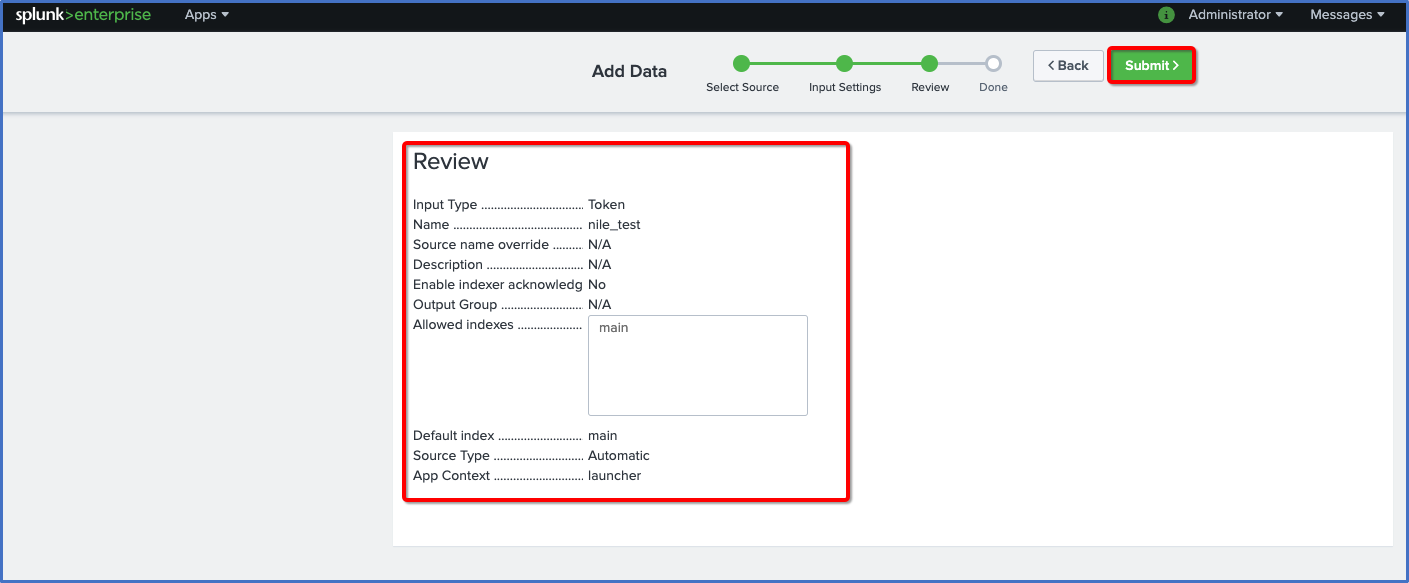
- Verify the HTTP Event Collector configuration.
- Click the Submit button
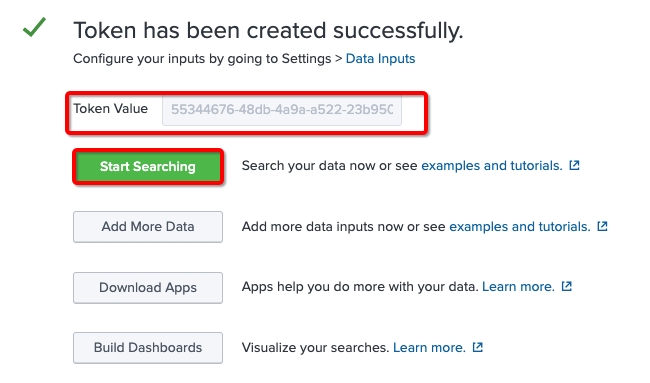
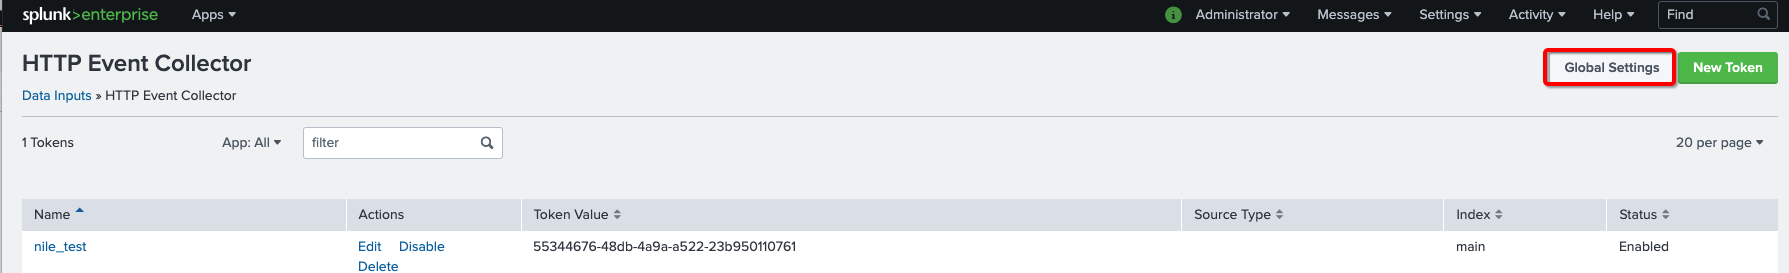
- Copy the contents of Token Value, and save it in a text file for later use in the Nile Portal settings.
(Example here is “55344676-48db-4a9a-a522-23b95C”.) - Click the Start Searching button
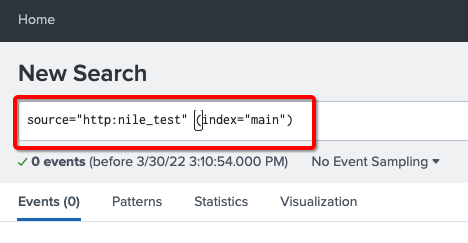
- Enter a search string; in this example,
source=”http:nile_test” (index=”main”)
Configure the Splunk HTTP Event Collector
After creating the HTTP Event Collector, enable the Collector, and configure the URL port and SSL options.
- From the Data section, click the Data inputs link
- Click on HTTP Event Collector link.
- In the HTTP Event Collector page, click on Global Settings button
- Enter these values into the form
All Tokens: click on Enabled
Enable SSL: check (HTTPS) or uncheck (HTTP) the checkbox
HTTP Port Number: 8088 (default).
Keep all other settings in their default value. - Click the Save button
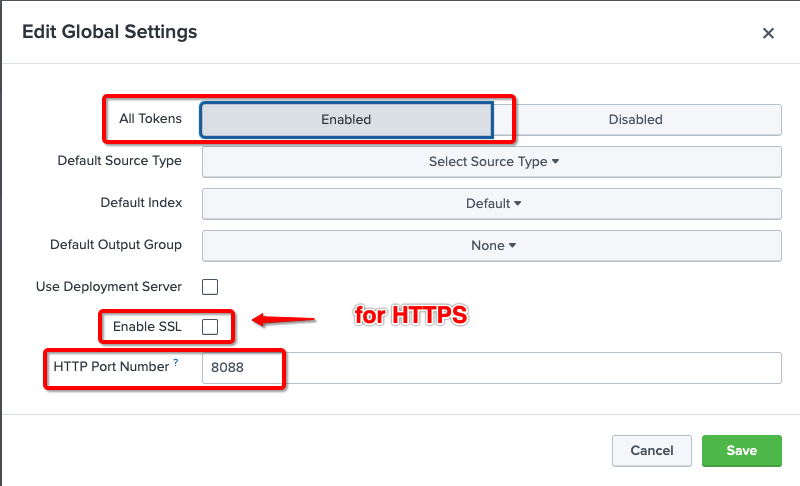
This example shows that SSL is disabled, and the port number is the default value.

NOTE
Important Note: The SSL and Port Number setting is a global setting, and will affect all HTTP Event Collectors.
Add Splunk collector to Nile Portal
- Login to Nile portal — https://u1.nile-global.cloud/ — using an admin account
- Navigate to (Settings button) → Global Settings tab → Integration subtab
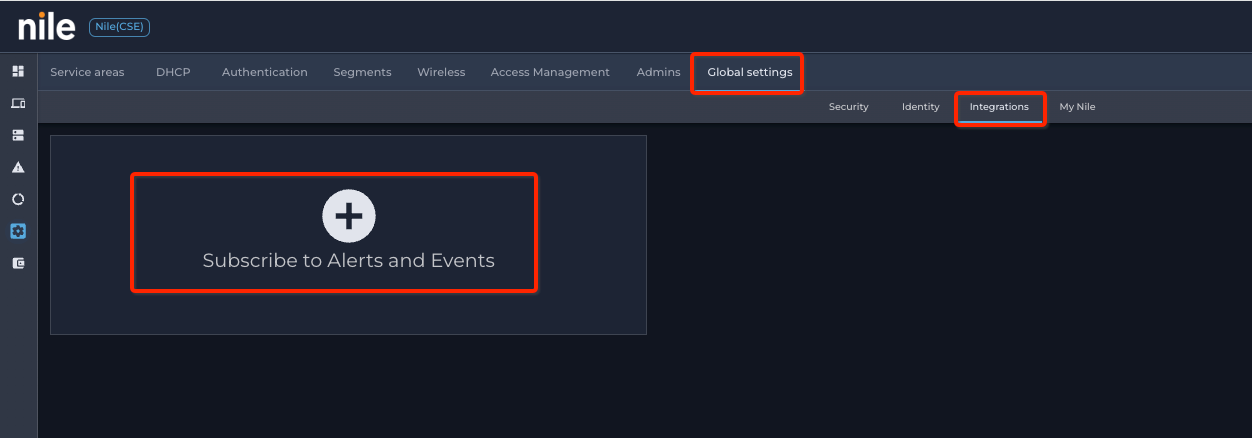
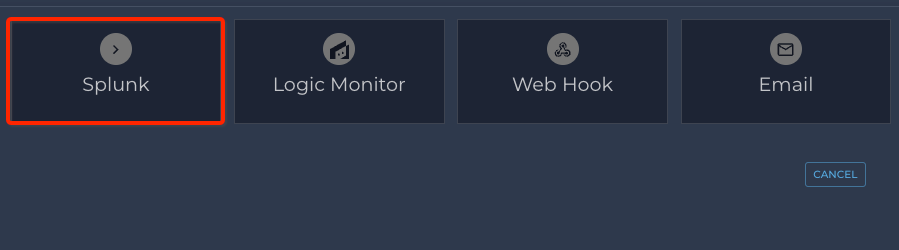
- Click on ⊕; a new popup window will open
- Click on Splunk
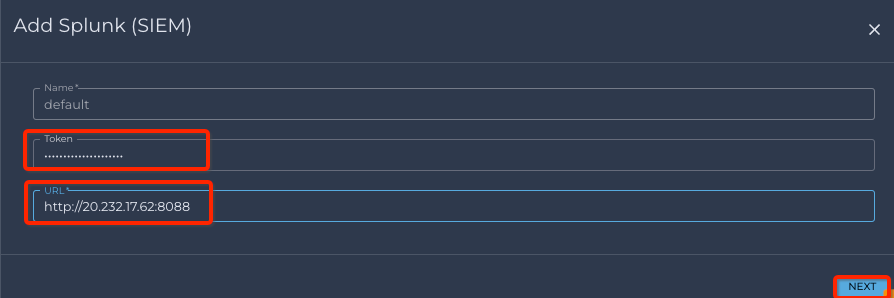
- Fill out Splunk information:
Token: Copy and paste the token saved when creating the Splunk HEC
URL: Enter Splunk cloud URL plus HTTP port number from Splunk HEC global settings (example: https://<customer_id>.splunlkcloud.com:8088 as in our settings we have 8088 as HTTP port number) - Click the Next button
 Select, by clicking on the checkboxes, if Audit, User Device Events, and/or Alerts need to be sent to Splunk
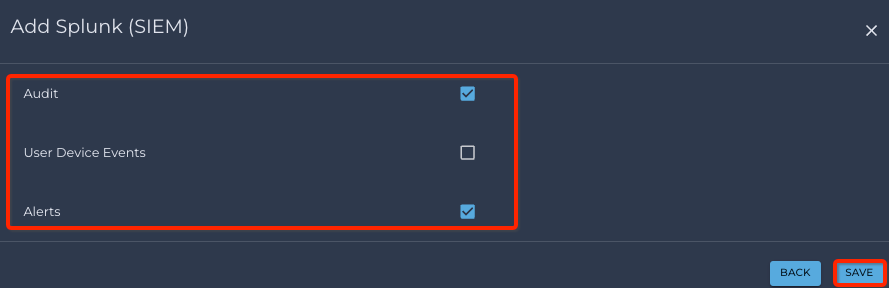
- Click the Save button to save the settings.
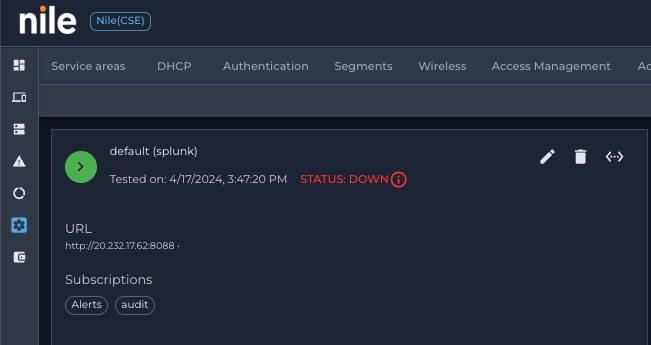
Click on Splunk, then click on ↔, to test the connection
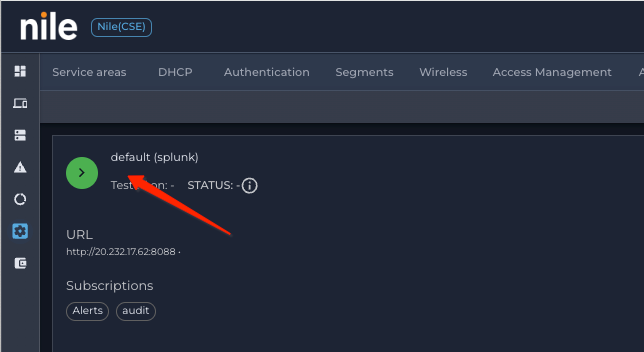
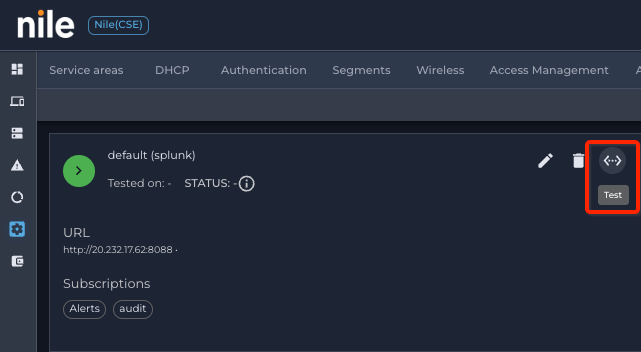
- If the test is successful, the collector status will change to UP (Green). if it fails it will show up as DOWN (red)
- To modify Splunk URL or Token, click on (pen); to delete Splunk integration, click on (trash)
Verify Nile Events under Splunk Search and Report:
- Login to Splunk instance as administrator.
- In the top menu, click on Search element
Use the HEC name as a source,
the index name for the specific index, and
the filter for searching for specific data.For this example, the HEC name is “nile_test”, the index name is “main”, and the filter is:
source=”http:nile_test” (index=”main”)
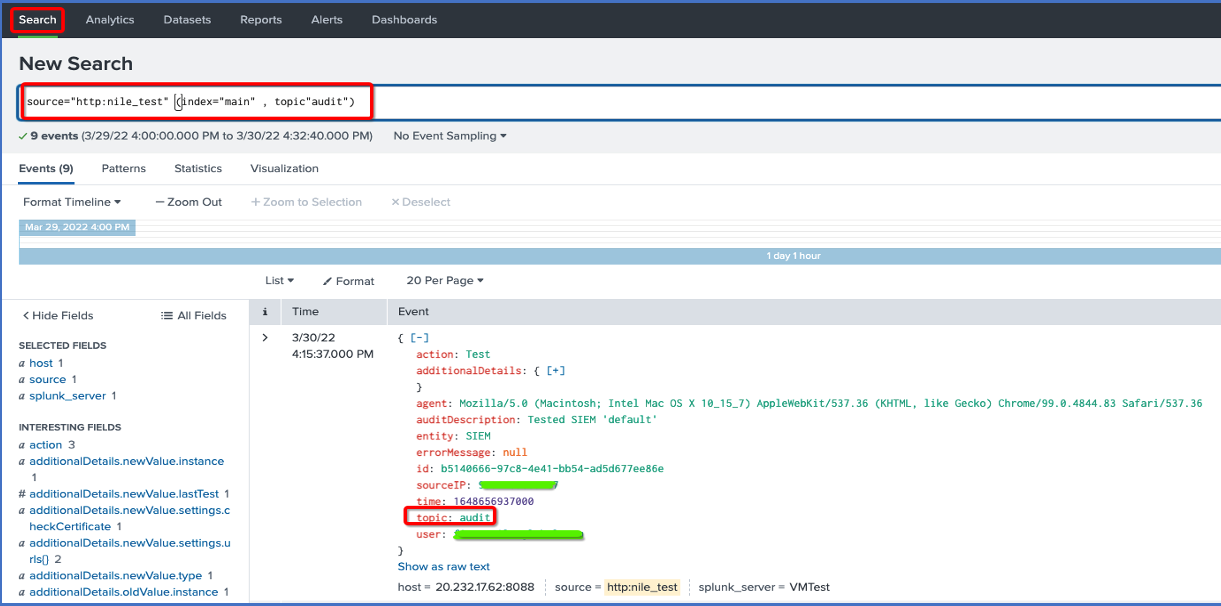
Use a topic name to display only audits or user device events
Examples:
source=”http:nile_test” (index=”main” , topic”audit”)
source=”http:nile_test” (index=”main” , topic”userdeviceevents”)